Pie Chart Questions Quiz 3
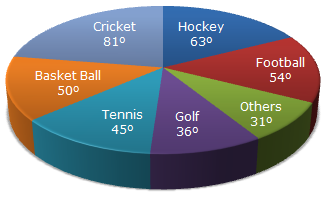
Question 1 How much percent more is spent on Hockey than that on Golf? A. 27% B. 35% C. 37.5% D. 75% Question 2 What percent of total spending is spent on Tennis? A. 12 1/2 % B. 22 1/2 % C. 25 % D. 45 % Question 3 If the total amount spent on sports during the year
Oct 14, 2015, 12:33 IST
The circle-graph given here shows the spendings of a country on various sports during a particular year. Study the graph carefully and answer the questions given below it.